EcoSend Insights Dashboard
Accessing your Dashboard 📈
You can access your Insights dashboard by clicking Insights from the left-hand side-menu bar.
The widgets displayed across Insights detail the key metrics of all email campaigns sent out via your EcoSend Broadcasts, Sequences, and Automated Messages.
You can adjust the time-period from the top right-hand corner in order, and use this to compare your campaigns over different time-periods.
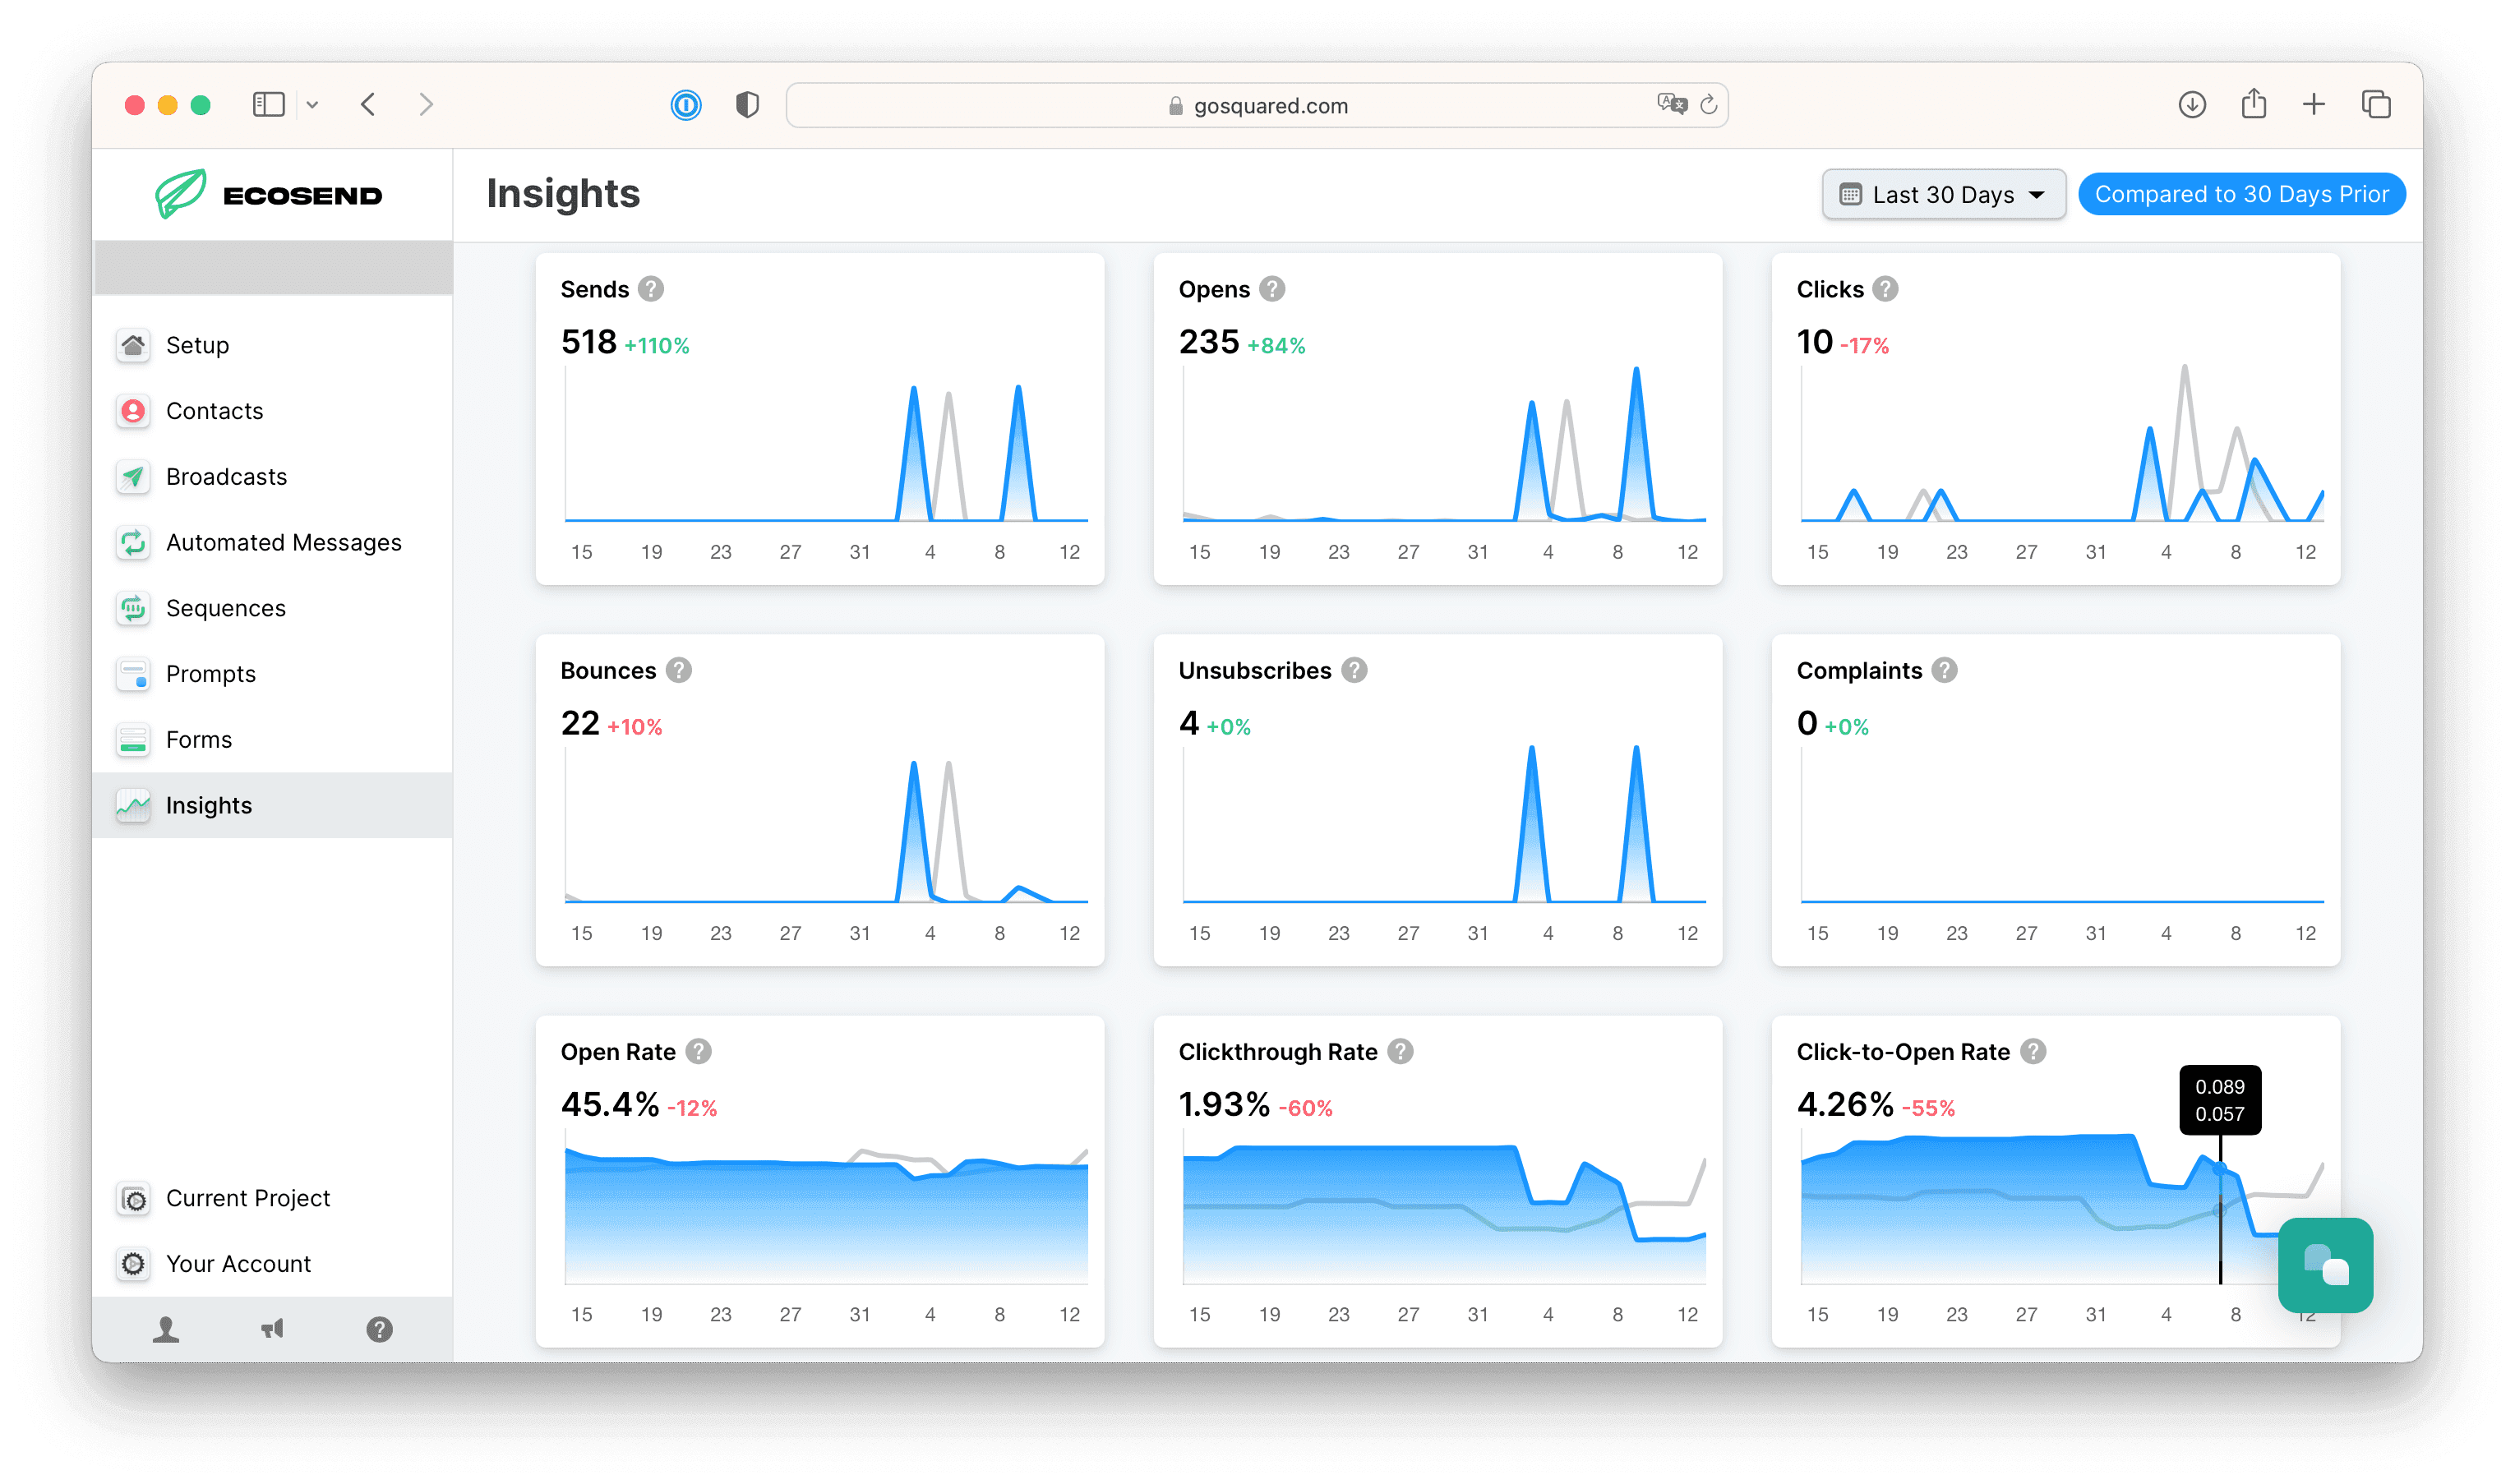
Key Metric Breakdown 👀
Sends
The total number of email messages that were sent in the time period.
Opens
The total number of messages that were opened in the time period.
Clicks
The total number of messages where a recipient clicked a link in the time period.
Bounces
Email messages that could not be delivered within the time period.
Unsubscribes
Total number of times an 'unsubscribe' link was clicked within emails within the time period.
Complaints
Total number of times an email was reported as spam by the recipient within the time period.
Open Rate
What percentage of emails were opened by recipients, calculated based on sends & opens within a 30 day window.
Click Through Rate
What percentage of emails were clicked by recipients, calculated based on sends & clicks within a 30 day window.
Click-to-Open Rate
For recipients who opened an email, what portion went onto click a link in the email, calculated based on opens & clicks within a 30 day window.
Bounce Rate
What percentage of emails weren't able to be delivered, based on sends & deliveries within a 30 day window. We expect all customers to maintain a bounce rate below 10%. If your bounce rate goes above 5%, we may reach out to discuss your email sending.
For our guide on identifying and removing regularly bouncing email addresses, please see our article here.
Unsubscribe Rate
What percentage of emails caused recipients to click an unsubscribe link, calculated based on sends & unsubscribe clicks within a 30 day window.
Complaint Rate
What percentage of emails were marked as spam by recipients, calculated based on sends & spam complaint feedback within a 30 day window. We expect all customers to maintain a complaint rate below 0.1%. If your complaint rate goes above 0.05%, we may reach out to discuss your email sending.
Analysing and Taking Action on your Data 💪
Use this information to optimise your email campaigns. If you notice your key metrics dropping off, some steps you can take include:
- Trying a different Subject Line with the EcoSend AI Subject Line Generator.
- Adjust the frequency of your messaging; you may be sending out too many emails within a short time-period, causing email fatigue.
- Or you may have neglected emailing your user-base for too long, so they have now gone cold and require more nurturing or a pruning of your email list.
- Reduce the number of CTA buttons within your message. We typically best results with 1 CTA per email, maximum.
- Reach out to us as 'hello@ecosend.io', and chat to us about booking an email Marketing strategy call!
Last updated September 2026